Procter & Gamble needed to understand which creative assets were driving product sales across their brand portfolio. Here’s how they built a solution to track and report on asset performance.
As a Fortune 500 consumer goods company, Procter & Gamble manufactures various products including shampoos, nappies and cleaning agents. Each finished product has multiple creative assets attached to it, such as company logos, graphics, designs or promotional stickers.
They needed reports on the utilisation, performance and sales attributes of each asset. But there were two key challenges:
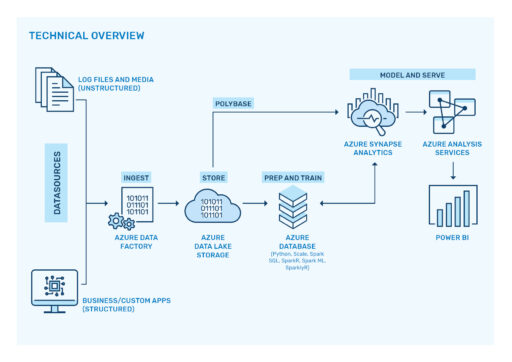
Procter & Gamble built a scalable business intelligence solution using Azure Data Services. The system extracts, cleanses and refines data from diverse sources, then loads the structured data into a data warehouse before generating asset reports in Power BI.
Here’s how it works:
Procter & Gamble now has visibility into how their creative assets perform across different platforms and products. They can see which logos, graphics and promotional materials drive sales, helping them make informed decisions about future creative investments.
The scalable solution grows with their business, handling new data sources and evolving requirements as they expand their product lines and marketing channels.
 Managed SharePoint Services
 Automation
 Microsoft 365 Consulting
 Power BI